
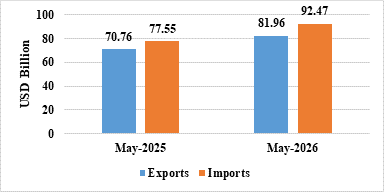
15 June 2026: India’s total exports (Merchandise and Services combined) for May 2026* is estimated at US$ 81.96 Billion, registering a positive growth of 15.83 percent vis-à-vis May 2025. Total imports (Merchandise and Services combined) for May 2026* is estimated at US$ 92.47 Billion, registering a positive growth of 19.23 percent vis-à-vis May 2025.
Table 1: Trade during May 2026*
|
| May 2026 (US$ Billion) | May 2025 (US$ Billion) |
Merchandise | Exports | 45.20 | 38.30 |
Imports | 73.41 | 60.86 | |
Services* | Exports | 36.76 | 32.46 |
Imports | 19.06 | 16.70 | |
Total Trade (Merchandise +Services) * | Exports | 81.96 | 70.76 |
Imports | 92.47 | 77.55 | |
Trade Balance | -10.51 | -6.79 |
* Note: The latest data for services sector released by RBI is for April 2026. The data for May 2026 is an estimation. (ii) Data for April-May 2025-26 and April-December 2025 has been revised on pro-rata basis using quarterly balance of payments data.
Fig 1: Total Trade during May 2026*
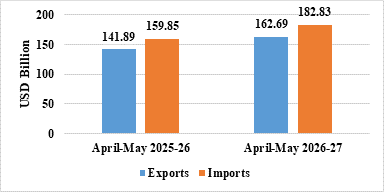
India’s total exports during April-May 2026-27* is estimated at US$ 162.69 Billion registering a positive growth of 14.66 percent. Total imports during April-May 2026-27* is estimated at US$ 182.83 Billion registering a growth of 14.38 percent.
Table 2: Trade during April-May 2026-27*
|
| April-May 2026-27 (US$ Billion) | April-May 2025-26 (US$ Billion) |
Merchandise | Exports | 88.91 | 76.59 |
Imports | 145.35 | 126.24 | |
Services* | Exports | 73.79 | 65.30 |
Imports | 37.48 | 33.61 | |
Total Trade (Merchandise +Services) * | Exports | 162.69 | 141.89 |
Imports | 182.83 | 159.85 | |
Trade Balance | -20.13 | -17.96 |
Fig 2: Total Trade during April-May 2026-27*
MERCHANDISE TRADE
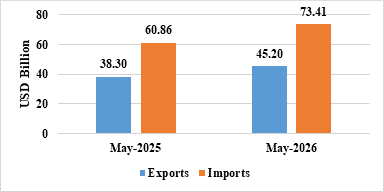
- Merchandise exports during May 2026 were US$ 45.20 Billion as compared to US$ 38.30 Billion in May 2025.
- Merchandise imports during May 2026 were US$ 73.41 Billion as compared to US$ 60.86 Billion in May 2025.
Fig 3: Merchandise Trade during May 2026
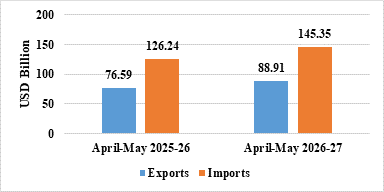
- Merchandise exports during April-May 2026-27 were US$ 88.91 Billion as compared to US$ 76.59 Billion during April-May 2025-26.
- Merchandise imports during April-May 2026-27 were US$ 145.35 Billion as compared to US$ 126.24 Billion during April-May 2025-26.
- Merchandise trade deficit during April-May 2026-27 was US$ 56.44 Billion as compared to US$ 49.65 Billion during April-May 2025-26.
Fig 4: Merchandise Trade during April-May 2026-27
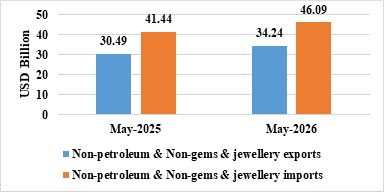
- Non-petroleum and non-gems & jewellery exports in May 2026 were US$ 34.24 Billion compared to US$ 30.49 Billion in May 2025.
- Non-petroleum, non-gems & jewellery (gold, silver & precious metals) imports in May 2026 were US$ 46.09 Billion compared to US$ 41.44 Billion in May 2025.
Table 3: Trade excluding Petroleum and Gems & Jewellery during May 2026
| May 2026(US$ Billion) | May 2025 (US$ Billion) |
Non- petroleum exports | 36.78 | 32.87 |
Non- petroleum imports | 50.73 | 46.11 |
Non-petroleum & Non-Gems & Jewellery exports | 34.24 | 30.49 |
Non-petroleum & Non-Gems & Jewellery imports | 46.09 | 41.44 |
Note: Gems & Jewellery Imports include Gold, Silver & Pearls, precious & Semi-precious stones
Fig 5: Trade excluding Petroleum and Gems & Jewellery during May 2026
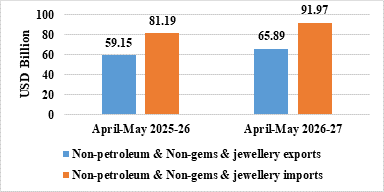
- Non-petroleum and non-gems & jewellery exports in April-May 2026-27 were US$ 65.89 Billion, compared to US$ 59.15 Billion in April-May 2025-26.
- Non-petroleum, non-gems & jewellery (gold, silver & precious metals) imports in April-May 2026-27 were US$ 91.97 Billion, compared to US$ 81.19 Billion in April-May 2025-26.
Table 4: Trade excluding Petroleum and Gems & Jewellery during April-May 2026-27
| April-May 2026-27(US$ Billion) | April-May 2025-26 (US$ Billion) |
Non- petroleum exports | 70.74 | 64.03 |
Non- petroleum imports | 104.05 | 90.79 |
Non-petroleum & Non Gems & Jewellery exports | 65.89 | 59.15 |
Non-petroleum & Non Gems & Jewellery imports | 91.97 | 81.19 |
Note: Gems & Jewellery Imports include Gold, Silver & Pearls, precious & Semi-precious stones
Fig 6: Trade excluding Petroleum and Gems & Jewellery during April-May 2026-27
SERVICES TRADE
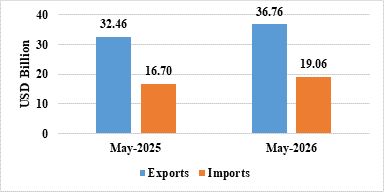
- The estimated value of services export for May 2026* is US$ 36.76 Billion as compared to US$ 32.46 Billion in May 2025.
- The estimated value of services imports for May 2026* is US$ 19.06 Billion as compared to US$ 16.70 Billion in May 2025.
Fig 7: Services Trade during May 2026*
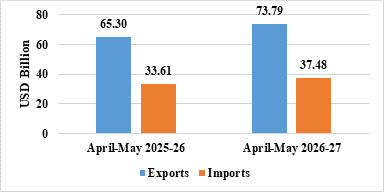
- The estimated value of service exports during April-May 2026-27* is US$ 73.79 Billion as compared to US$ 65.30 Billion in April-May 2025-26.
- The estimated value of service imports during April-May 2026-27* is US$ 37.48 Billion as compared to US$ 33.61 Billion in April-May 2025-26.
- The services trade surplus for April-May 2026-27* is US$ 36.31 Billion as compared to US$ 31.69 Billion in April-May 2025-26.
Fig 8: Services Trade during April-May 2026-27*
- Exports of Other Cereals (262.73%), Petroleum Products (54.89%), Meat, Dairy & Poultry Products (42.51%), Oil Meals (24.61%), Engineering Goods (24.48%), Handicrafts Excl. Hand Made Carpet (23.85%), Plastic & Linoleum (21.82%), Iron Ore (14.76%), Organic & Inorganic Chemicals (12.71%), Electronic Goods (11.62%), Gems & Jewellery (6.66%), Drugs & Pharmaceuticals (6.13%), Rice (5.38%), Cereal Preparations & Miscellaneous Processed Items (4.4%), Coffee (4.37%), and Cotton Yarn/Fabs./Made-Ups, Handloom Products Etc. (1.89%) record positive growth during May 2026 over the corresponding month of last year.
- Imports of Silver (-86.65%), Project Goods (-64.05%), Chemical Material & Products (-63.58%), Pearls, Precious & Semi-Precious Stones (-26.5%), Iron & Steel (-12.47%), Pulp And Waste Paper (-9.93%), Machine Tools (-8.14%), Newsprint (-6.69%), Textile Yarn Fabric, Made-Up Articles (-3.68%), and Wood & Wood Products (-3.65%) record negative growth during May 2026 over the corresponding month of last year.
- Services exports is estimated to grow by 12.99 percent during April-May 2026-27* over April-May 2025-26.
- Top 5 export destinations, in terms of change in value, exhibiting positive growth in May 2026 vis a vis May 2025 are Singapore (68.96%), South Africa (116.21%), Tanzania Rep (196.89%), Italy (87.54%), and Sri Lanka Dsr (150.29%).
- Top 5 export destinations, in terms of change in value, exhibiting positive growth in April-May 2026-27 vis a vis April-May 2025-26 are Singapore (123.75%), Tanzania Rep (172.22%), Sri Lanka Dsr (183.32%), South Africa (62.24%), and China P Rp (25.85%).
- Top 5 import sources, in terms of change in value, exhibiting growth in May 2026 vis a vis May 2025 are Russia (63.46%), China P Rp (23.4%), U S A (54.43%), Oman (305.66%), and Brazil (358.83%).
- Top 5 import sources, in terms of change in value, exhibiting growth in April-May 2026-27 vis a vis April-May 2025-26 are Russia (40.02%), China P Rp (22.15%), Oman (277.63%), U S A (19.4%), and Brazil (180.35%).


0 Comments